Our White Paper
Lysa is an automatic investment service that strives to maximise the customers return based on the individual investment goals, economic situation and risk tolerance. This whitepaper describes how we do that. Don't hesitate to contact us if you have any questions.
1. Lysa's investment philosophy
Lysa's management philosophy is simple, consistent and effective. We believe that good management is based on three fundamental principles.
Customised: We start with the customer's capacity and willingness to expose themselves to different types of investment risk. Lysa customises and manages a customer's portfolio tailored to the customer's goals, financial situation and preferences. We work hard to ensure that our customers do not feel concerned about how their portfolio is doing, and only take risks that they can manage.
Evidence-based: Our management is based on empirical data and validated research. We use clear and robust conclusions in academic research as a guide for how a customer can invest optimally. The key conclusions are that:
Risk and expected return are highly correlated. Customers that are looking for a higher return must accept more risk [1]
Fees have a very large impact on the return. Low-cost products such as index investments save the customer a great deal of money and give a higher return [2]
Good diversification increases the customer's expected risk-adjusted return [3]
Transparent: We report openly what we invest in and why. Lysa's pricing is simple and clear. We treat all our customers equally; there are no side agreements. Lysa is organised to minimise and eliminate conflicts of interest that arise between managers and customers. We never accept hidden fees or kickbacks[4]
Lysa believes in the interaction of humans and technology. Our investment team has developed an investment process that allows us to customise the portfolios for our customers. We put a lot of time and care in ensuring that our funds have the best possible exposure. Our development team has developed a smart technological platform to streamline processes. This reduces the costs for our customers. We can therefore offer first-class management at a fraction of the cost of traditional asset management.
2. Lysa's investment methodology
The two most important questions in an investment decision are ”What kind of return can I expect?” and ”At what risk?”. These questions are difficult to answer as neither the expected return or risk are observable. Once the investment is made and time has passed, we can evaluate the realised return, but it is difficult to evaluate what risk we took. Of all possible outcomes, one was realised. But other outcomes, more or less successful, were also possible. These may even have been more likely than the actual outcome.
What we can do is draw conclusions about future returns and risks in any given investment or portfolio using historical data, logic and research.
Lysa's investment process aims to give the customer the right balance between return and risk. To achieve this, Lysa's investment team has created a five-step process:
Select asset class/factors
Select index or funds and ETFs that best represent each asset class/factor
Establish an optimal mix between different asset classes
Customise a suitable portfolio for the customer
Monitor, rebalance and update the customer's portfolio
2a. Choice of asset class/factors
Research shows that the best way to maximise return at each level of risk is to create groups of instruments with similar return and risk characteristics instead of investing in individual instruments [5]. The first step in Lysa’s investment methodology is therefore to identify and evaluate different groups of instruments. One common method is to group instruments in asset classes (e.g. equities and interest rates). Another is to organise portfolios and assets according to the extent to which their return is geared to so-called factors (e.g. market factor, small cap factor and credit factor). Lysa analyses and invests from both asset class and factor perspectives.
Asset class refers to equities and interest-bearing assets. Factors are a collective name for the sources of covariance between different assets. For example, returns on different equities (”market risk”), the share price of companies with low valuation (”value”), the share price of small companies (”size”), and for shares that have recently risen (”momentum”)[6]. It is possible that Lysa may in the future add more factors to customer portfolios, but there is currently no investment tool that has an effective exposure to well-documented factors at a reasonable cost, with the exception of market risk.
Lysa's asset classes are equities and interest-bearing securities (”interest rates”). Equities give investors good exposure to economic growth while protecting them against inflation. Since 1918, Swedish equities have generated a real return of 7.1% per year, significantly higher than other asset classes. Interest rates are the most important income-generating asset class. Interest rates provide a more reliable return than equities, but have a more limited upside [7]. Swedish interest rates have had a real annual return that is considerably lower than equities, 3.3% for bonds and 2.1% for government securities. Over time, the difference will be large due to the interest-on-interest effect as shown in Figure 1.
Figure 1: Return on equities, bonds and government securities (real terms)
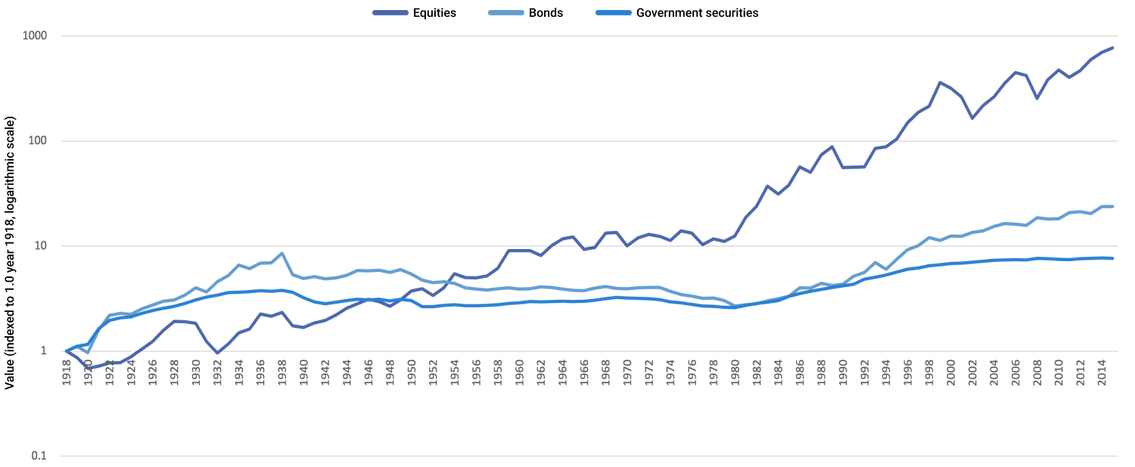
Figure 1. Return on Swedish equities, bonds and government securities in real terms 1918-2016 (Frennberg & Hansson, 1992 and Lysa analysis)
Unfortunately, there is no such thing as a ”free lunch”. The reason that equities have a higher return than interest rates is that they have higher risk. One parameter used by Lysa to measure risk is volatility. It measures how much the price of a financial asset fluctuates or varies over time. The more the asset’s value fluctuates, the higher the volatility of the asset [8]. The Stockholm Stock Exchange's volatility since 2000 is around 26%. Interest rate volatility during the same period was approx. 4%. Equity volatility may be very high for short periods of time. In 2008, the value of the Stockholm Stock Exchange fell by 39%, and in 1999 it increased by 70%.
One important observation is that volatility has historically declined over longer periods of time. This means that the more time that passes, the more likely we are to achieve our expected return. Figure 2 illustrates the equity market’s annual return for different time periods. The graph shows that the stock market as a whole for all 15-year periods since 1918 has generated a real annual return between -0.4% and 17.7% depending on the time period.
Figure 2: Maximum and minimum return on equities
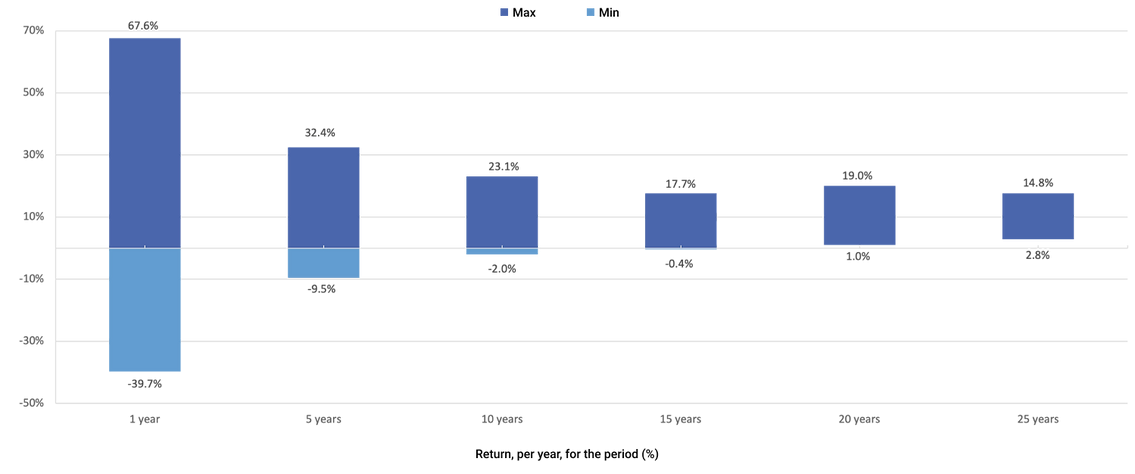
Figure 2. Maximum and minimum annual return for Swedish equities for different time periods 1918-2016 (Frennberg & Hansson, 1992 and Lysa analysis)
Asset classes can be divided into subclasses. We divide the equities asset class geographically. It is important to have good exposure to different geographies. Figure 3 shows that Sweden, Denmark and Finland have had a relatively high return on equities during the period 1900-2013. The trend in Belgium, Italy and Germany has been weaker. It is uncertain whether Sweden, Denmark or Finland will continue to outperform other countries in the future. A Nordic investor can therefore increase their risk-adjusted return by investing in other countries than their home market.
Figure 3: Annual real return for equities, bonds and government securities in different geographies

Figure 3. Dimson et al. (2000), the authors’ update to 2015
We divide the asset class interest rates into sub-asset classes based on credit risk and geography. Credit risk analyses are usually based on volatility. Lysa believes that this is a measure of risk that is highly questionable. One particular problem with the volatility parameter is that it is an average measurement over long periods of time and therefore provides an indication of the risk in normal conditions. In sharp market downturns, this asset class may behave differently than normally. Lysa therefore also takes into account the way asset classes behave in such negative scenarios. In sharp market downturns, the correlation between asset classes increases, making it more difficult to protect the asset value [9], see Table 1
Table 1: Trend of different asset classes in the financial crisis 2008
| Asset class | Measurement | Value increase/- decrease in 2008 |
|---|---|---|
| Global bonds | Citigroup world government | 10.9% |
| Core bonds | Barcap aggregate index | 5.2% |
| Cash | Three-month T-bill | 1.3% |
| TIPS | Citigroup US inflation linked | -1.2% |
| Emerging market bonds | JPM emerging market bond index | -9.7% |
| Private Real Estate | NCREIF property index | -16.9% |
| Fixed income hedge funds | HFRI fixed income index | -17.8% |
| Private capital | Venture economics (venture and buyouts) | -20.0% |
| Equity hedge funds | HFRI equity hedge index | -20.6% |
| US high yield | Merrill Lynch high yield master | -26.3% |
| Small cap equity | Russell 2000 | -33.8% |
| Commodities | Dow Jones AIG commodity index | -35.7% |
| Large cap equity | S&P 500 | -37.0% |
| Public real estate | NAREIT equity RETIS | -37.7% |
| International equity | MSCI world ex US | -43.2% |
| Emerging market equity | IFC emerging markets | -53.2% |
Table 1. Re (2014). Percentage performance of different asset classes during the financial crisis 2008
Lysa therefore opts to focus on bonds, which protect the investor's assets in market downturns. Based on a careful selection process, Lysa has selected the subclasses in Table 2.
Table 2: Asset classes and subclasses that Lysa invests in
| Asset class | Advantage | ||
| Equities (subclasses) | |||
| European equities | Exposure to European companies and protection against inflation | ||
| US equities | Exposure to US companies and protection against inflation | ||
| Equities of other mature countries | Exposure to other mature countries’ companies and protection against inflation | ||
| Emerging countries | Exposure to emerging countries' companies and protection against inflation | ||
| Small caps | Exposure to global small caps | ||
| Interest rates (subclasses) | |||
| Global interest-bearing government and corporate bonds | Low volatility, low correlation with equities and protection against deflation | ||
| Global short term interest-bearing government and corporate bonds | Low volatility, high liquidity and protection against rising interest rates (inflation) | ||
Table 2. Lysa analysis
Lysa opts not to work with ”alternative” asset classes, such as currencies, commodities, private equity and hedge funds as we believe they do not contribute sufficiently to the portfolio composition to justify the costs and risks associated with investing in them.
2b. Choice of funds and ETFs that best represent each asset class/factor
Lysa has a broad investment universe and can choose the most suitable index for each region or, if more cost effective, invest in all funds and ETFs traded in established markets. Lysa regularly analyses index, funds and ETFs to select the strategy that best represent the desired asset classes, either individually or in combination with other funds.
When Lysa invests in underlying funds and ETFs we normally avoid funds and ETFs that are actively managed and prefer to invest in index funds. A large number of international research reports have shown that 65-75% of actively managed funds underperform their benchmark index every year. Research also shows that those who outperform the index one year do not outperform it the following year[10]. Table 3 shows the conclusions of a number of major studies of how actively managed funds underperform their index on a risk-adjusted basis every year. Lysa does not know of any trustworthy study that shows that actively managed funds outperform their index on average.
Table 3: Underperformance of actively managed funds against index
| Study | Funds’ annual underperformance against index after costs |
|---|---|
| Barras et al. (2010) | -0.5% |
| Berk and Binsbergen (2012) | -0.7% |
| Fama and French (2010) | -1.0% |
| Kosowski et al. (2006) | -1.2% |
Table 3. Lysa analysis
When selecting indexes, multiple factors are analyzed to ensure that the exposure provided to customers complements the other parts of the portfolio in a cost-effective manner. Among the factors analyzed are:
- Company Size: Lysa aims to achieve the broadest possible diversification by including as many companies as possible in the index, regardless of size.
- Regional Exposure: Similar to company size, Lysa strives for the widest possible exposure by investing in as many countries and regions as possible.
- Weighting of Companies: Lysa primarily follows market-capitalization-weighted indexes.
- Liquidity and Tradability: To minimize transaction costs and ensure daily liquidity, Lysa seeks to follow indexes that apply rigorous criteria for the liquidity of the companies included.
When investing in funds and ETFs, analysis is performed by sub-asset classes. For each sub-asset class, the funds that best represent the sub-asset class are identified, either individually or in combination with other funds. The analysis covers:
Fund fees:
Lysa endeavours to invest in funds with the lowest fees within their respective asset classTransaction costs of the fund:
Lysa aspires to choose funds that trade efficiently and at low transaction costsCommission, spread and settlement fees:
Lysa strives for low costs associated with acquiring and divesting the fundHow the fund is traded:
ETFs can be traded at any time of the day. A traditional fund is traded directly with the Fund Company once a day. Lysa has no preferences between ordinary funds and ETFs. Lysa only trades in reputable markets. Märkten.The fund’s liquidity and the size of the assets managed by the fund:
Lysa prefers to invest in liquid funds that are easy to buy and sell without affecting market pricing.Tracking difference and tracking error:
Lysa evaluates how effectively the fund follows its underlying index. We prefer funds with the minimum possible deviation.The fund’s domicile:
We prefer funds that meet UCITS requirements and are supervised by a permit authority within the EEAHow the fund replicates its underlying index (physically or synthetically):
Lysa prefers physical replicationReputation:
Lysa only chooses fund managers who are stable and have the capacity to manage the fund.Tax situation for the fund:
Lysa invests in funds that are domiciled in the EEA and have an efficient tax situation. The fund’s tax situation also depends on which market it’s traded in, what it invests in, and whether or not it distributes dividends.
Based on these criteria, we have chosen the following funds and ETFs:
Table 4: Lysa’s chosen funds
As of November 2024. The list may change over time if new better funds are launched.
| Asset class | Fund/ETF | ||
| Equities (subclasses) | |||
| European equities | Lysa Global Equity Broad | ||
| US equities | Lysa Global Equity Broad | ||
| Asia and Australia | Lysa Global Equity Broad | ||
| Emerging countries | Vanguard Emerging Markets Stock Index Fund | ||
| Global small cap | Vanguard Global Small Cap Index | ||
| Interest rates (subclasses) | |||
| Global interest-bearing government and corporate bonds | Vanguard Global Bond Index Fund USD Hedged - Acc | ||
| Global short term interest-bearing government and corporate bonds | Vanguard Global Short-Term Bond Index Fund USD Hedged - Acc | ||
Table 4. Lysa's selected funds
Several of these fund providers offer distribution commissions to managers to invest in that particular fund provider’s fund. Lysa never receives commissions. Instead we ensure that commissions will benefit Lysa’s customers by reducing Lysa’s fees by the full amount of commission. If a fund provider offers a 50% commission on an annual fee of 0.2%, the effective fee for Lysa’s customer will be 0.1% in that fund.
2c. Establish an optimal mix between different funds and ETFs
Lysa’s investment philosophy is based on the assumption that the financial markets are generally efficient, i.e. a higher expected return presupposes higher risk. This is supported by extensive, well-developed research literature which documents that active investment strategies (which aim to achieve higher returns without taking more risk, i.e. creating "alpha") generally underperform or provide a neutral contribution before fees. Every year, some active managers have a higher risk-adjusted return than normal, while others have a lower return. It has proved impossible to identify in advance active managers who will reliably generate a positive risk-adjusted return (deliver "alpha")[11]. For the investor, therefore, active investments are typically unattractive even before fees. None of Lysa’s portfolio choices are aimed at identifying under-priced assets or otherwise identifying mispricings in financial markets.
Lysa believes that a well-balanced portfolio for all investors is based on broad exposure to the global market. For interest-bearing securities, Lysa has created a portfolio with a focus on low correlation with equities and low volatility. The purpose of the portfolio’s equity portion is primarily to provide a return, while the purpose of investments in interest-bearing securities is primarily to provide stability to the portfolio and reduce large declines in the portfolio value during bad times.
On the interest rate side, we therefore employ a broad mix of different types of interest-bearing securities, i.e. treasury bills and bonds issued by governments, companies and other organisations. We place great emphasis on the interest portfolio having a low degree of covariance with the equity portfolio. The portfolio consists of both short term and longer term duration bonds which allows us to adjust the duration for each customer depending on their specific investment horizon.
2d. Customise a suitable portfolio for the customer
In order to recommend a suitable portfolio for a customer, Lysa needs to understand the purpose of the customer’s investment, the customer’s financial situation and the customer’s view on return and risk. Therefore, Lysa asks a number of questions and conducts a so-called suitability assessment. Lysa combines objective questions such as "What is your monthly income?” with subjective ones such as "What is most important to you when you save?”. Combining objective and subjective questions enables Lysa to see the big picture. Lysa will perform the analysis even if the customer’s answers are consistent. If the customer’s responses are inconsistent, the customer is likely to have a lower risk tolerance and we therefore adjust the risk down in our recommended portfolio composition.
In the next step, the customer has access to a decision-making tool where they can adjust their risk level and choose investment focus. If the customer chooses a significantly more or less risky portfolio than Lysa recommends, Lysa advises the customer not to invest. This is because Lysa considers the portfolio to be unsuitable for the customer.
In order to offer individually adapted, cost efficient and secure savings, Lysa manages the UCITS funds “Lysa Global Equity Broad”, “Lysa Emerging Markets Equity Broad”, “Lysa Global Small Cap Equity Broad”, “Lysa Global Fixed Income” and “Lysa Global Short Term Fixed Income” (jointly “Lysa funds”). These funds represent what Lysa considers to be an optimal mix of sub-classes (geographies and risk level) depending on investor residence. Lysa’s funds acquire the funds chosen by Lysa in the second stage of the investment process: "Selection of funds that best represent each asset class". Lysa’s customers become unitholders of Lysa’s funds and, through them, part-owners of the funds that are hand-picked by Lysa. The reason Lysa uses this fund structure is that is that:
- It is secure for the customer to be a unitholder in Lysa’s funds. Should anything happen to Lysa, the customer’s investments are secured in Lysa’s funds. The funds comply with clear and established regulations.
- Advantages of scale are cost-effective in both management and monitoring. All Lysa’s customers’ individual purchasing power is ”pooled” and customers are therefore given better terms than they would have received on their own, resulting in low transaction costs.
- This means that customers are fully invested. As the Lysa customer owns a share of Lysa’s funds, the entire amount invested in the fund is invested in the correct proportions, which is why the customer avoids the so-called "fractional share" problem.
By combining the two funds, each customer’s savings and investments can be invested on the so-called "efficient front" in order to maximise the customer’s return, given the investment risk that the customer is prepared to accept.
2e. Monitor, rebalance and update the customer’s portfolio
A portfolio that combines equities and interest rates does not remain optimal over time. There are several reasons for this:
- There is a rapid development of cheap index products. New, better funds are launched.
- Market movement means that the customer’s portfolio deviates from the initial allocation. Accordingly, the customer’s risk becomes higher or lower than the desired level.
- The conditions and purpose of the customer’s savings and investments may change.
To maintain efficient management and a constant level of risk, Lysa continuously monitors the customer’s investments. In order to maintain a portfolio that is suitable for the customer, Lysa rebalances the portfolio when it deviates from the portfolio’s target allocation. An analysis by David Swensen, Chief Investment Officer at Yale University, concluded that rebalanced portfolios yielded an average of 0.4% more per year, with less risk, over 10 years than non-rebalanced portfolios[12]. An analysis by Burt Malkiel and Charley Ellis produced a similar result over different 10-year periods[13].
Lysa will also follow up with the customer if the customer’s circumstances have changed. If the customer’s circumstances have changed, Lysa can submit a new investment proposal and update the customer’s portfolio. Lyss strives continuously to improve our customers’ experience and investments. Our system is flexible and when Lysa implements improvements, they automatically benefit the customer.
3. Conclusion
Lysa combines its experienced investment team’s judgement with a smart automated investment platform. This means that we can offer powerful management options that maximise our customers’ return on the basis of their individual goals, financial situation and risk tolerance. After removing conflicts of interest between itself and the customer, Lysa can offer an investment option that entails lower fees, good diversification and a higher expected return for the customer.
Risk information
Investing in securities always involves a risk. The Fund may both increase and decrease in value, and you may not always recoup the entire amount that you invested. Past performance is no guarantee of future performance.
References
- Re, A. and Chen J. (2002), "Asymmetric Correlations of Equity Portfolios”
- Ang, A., Chen, J. and Xing, Y. (2002) Downside Risk Review of Financial Studies
- Re, A. (2014) "Asset Management: A Systematic Approach to Factor Investing ", Oxford Financial Press
- Arnott, R., Berkin, A., &; Ye, J. (2000). “How Well Have Taxable Investors Been Served in the 1980s and 1990s? ” Journal of Portfolio Management
- Barras, L., Scaillet, O. and Wermers, R. ”False Discoveries in Mutual Fund Performance: Measuring Luck in Estimated Alphas ", The Journal of Finance
- Berk, J. and van Binsbergen, J. (2012), "Measuring Managerial Skill in the mutual fund industry”, National Bureau and Economic Research
- Bogle, J. (2009) Common Sense on Mutual Funds Wiley
- Brinson, G., Hood, L. and Beebower, G (1986) "Determinants of Portfolio Performance. ” Financial Analyst Journal
- Brinson, G., Singer, D. and Beebower, G. (1991) Determinants of Portfolio Performance II: An Update, Financial Analysts Journal
- Carhart, M, 1997, "On the persistence of Mutual Fund Performance", Journal of Finance
- Cremers, M., Halling, M., and Weinbaum, D. (2015) "Aggregate Jump and Volatility Risk in the Cross Section of Stock Returns” The Journal of Finance
- Dimson, E., Marsh, P. and Staunton, M. (2000) “Triumph of the Optimists: 101 Years of Global Investment Returns", Princeton University Press
- Fama, E. and French, K., (1992) "The cross-section of expected stock returns”, Journal of Finance
- Flam, H. and Vestman, R. (2014) "Swedish Equity Mutual Funds 1993-2013: Performance, Persistence and Presence of Skill
- Frennberg P. and Hansson B. (1992) Swedish stocks, bonds, bills and inflation (1919-1990), Applied Financial Economics
- Ibbotson, R. G. and Kaplan, P.D. (2000) "Does Asset Allocation Policy Explain 40, 90, or 100 Percent of Performance", Financial Analysis Journal
- Jegadeesh, N. and Titman, S. (1993) "Returns to buying winners and selling losers: Implications for stock market efficiency ", Journal of Finance
- Jegadeesh, N. and Titman, S. (2001) ”Profitability of momentum strategies: An evaluation of alternative explanations", Journal of Finance
- The Swedish Consumer Agency's report (2014:14) ”Long-term financial saving services to consumers - basis for assessing opportunities for action”
- Kosowski R., Timmermann A. and Wermers R. (2006) Can mutual fund 'stars' really pick stocks? New evidence from a boot analysis ", Journal of finance
- Markowitz H. (1952) "Portfolio Selection" Journal of Finance
- Malkiel B., (2012) "A Random Walk Down Wall Street”, Norton & Company
- Malkiel B. & Ellis C. (2013) "The Elements of Investing”, John Wiley & Sons
- Sharpe, W. (1964) "Capital Asset Prices: A Theory of Market Equilibrium Under Conditions of Risks, Journal of Finance
- Siegel, J. J. (2014) "Stocks for the Long Run”, McGraw Hill
- Swensen, D. (2005) Unconventional Success Free Press
- Markowitz (1952)[Tilbage til afsnittet]
- Arnott et al. (2000), Bogle (2009), Malkiel (2012), Flam and Vestman (2014) and Cremers et al (2015)[Tilbage til afsnittet]
- Markowitz (1952)[Tilbage til afsnittet]
- Studies show that financial services provided and recommended are adversely affected by conflicts of interest and incentives. As an example, see the Swedish Consumer Agency's report (2014:14)[Tilbage til afsnittet]
- Markowitz (1952), Sharpe (1964), Brinson et al. (1986), Brinson et al. (1991) and Ibbotson and Kaplan (2000)[Tilbage til afsnittet]
- Se Fama and French (1992), Jegadeesh and Titman (1993, 2001).[Tilbage til afsnittet]
- Siegel (2014), Dimson et al. (2000)[Tilbage til afsnittet]
- Volatilitet definieras som standardavvikelsen på en tillgångs avkastning. [Tilbage til afsnittet]
- Ang and Chen (2002)[Tilbage til afsnittet]
- Se t ex Bogle (2009), Malkiel (2012), Arnott, Berkin and Ye (2000) and Flam and Vestman (2014)[Tilbage til afsnittet]
- Carhart (1997)[Tilbage til afsnittet]
- Swensen (2005)[Tilbage til afsnittet]
- Malkiel & Ellis (2013)[Tilbage til afsnittet]